How to prepare a basic report in GA4 and understand whether your marketing is working?

4min.

Comments:0

06 November 2025

Ads
How to prepare a basic report in GA4 and understand whether your marketing is working?d-tags
You run various marketing activities, including advertising campaigns and sending newsletters, but you're not entirely sure if they're effective and, above all, what works. Using analytical data is the basis for making good business decisions. How to approach the GA4 tool to extract the data you need, and what to watch out for? Read on to find out!

4min.

Comments:0

06 November 2025

Data without context can do more harm than good

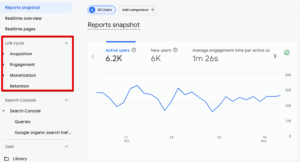
You open GA4 and don’t know where to start? All the charts, tables, tabs — the amount of data available can be overwhelming. However, to get what you need from the tool, you don’t have to start by checking all the tabs. First, ask yourself what you actually want to find out.

Depending on the marketing activities you carry out, these questions may include, for example:

  • Do the campaigns I run actually bring new users to the site?
  • Do SEO activities generate customers and conversions, or just traffic?
  • Is my newsletter actually selling?
Until you prepare such questions, it will be difficult for you to build the right report. The starting point for working with Google Analytics 4 is to determine your success metrics and the basis on which you can conclude that your marketing is effective.

What will you need to create a basic report in GA4?

First, make sure that your website already has a Google Analytics 4 account implemented and configured. If you’re unsure about how to proceed and are still at this stage, please don’t hesitate to contact us.

If you already have an account connected, make sure you have editor or administrator access to your Google account — this will be useful when creating custom reports. It’s also a good idea to connect Google Ads and Search Console to GA4 to have access to complete data.

 The code is implemented on the website, access is granted – you’re ready to go!

To begin, go to the ready-made reports and review the most critical data

Some of your marketing questions may be answered by ready-made reports that collect the most popular metrics. After expanding the reports tab, you will see, among other things:

  •  Acquisition – These reports will be key to analyzing where users come from on your website. You can check whether your advertising campaigns are actually bringing traffic and which sources are providing you with the most visits. Such a ready-made summary can help you understand which activities are actually practical.
  •  Engagement – this tab provides information about user behavior on your website. You can see how much time they spend on your website, which pages are most frequently visited, and what actions they take – whether they scroll, submit forms, etc.
  •  Monetization – this will be your source of data on website sales. Here you will find information about which traffic sources generate the most sales, which products sell the most, and what the average shopping cart value is in your store.
  •  Retention – these reports show whether users return to your website, how many are new, and how many are returning users. This report can help assess the effectiveness of building loyalty among potential customers.

podstawowe raporty w panelu ga4

Source: GA4


Now you know where to find basic information that may help you find answers to your questions. This is a good starting point before you start digging deeper.

How to create a customized report in GA4?

 Although it may seem complicated and less intuitive at first, I recommend creating dedicated reports in explorations. This tab allows you to easily “extract” all the data you may need. You can also combine them freely, which helps you understand the data. You can find the report creation panel here:

explore ga4

Source: GA4

Then select a blank exploration:

eksploracja ga4

Source: GA4

 What can you add to such a report? If, for example, you want to see in one view which traffic sources bring the most traffic to your website, how many conversions they generate, and what the total revenue is, add the following metrics:

  • Add Session source/medium to Dimensions, then drag this element to the row section on the right.
  • Add Sessions, Transactions, and Purchase revenue to Metrics, then drag them to the Values field on the right:

budowanie podstawowego raportu ga4

Source: GA4

 This will provide you with a table that displays, in a single view, which traffic sources and marketing channels are the most effective and which generate the most revenue.

You can freely experiment with dedicated reports, check and compare different data, and if in doubt, you can use the advice of any LLM model (e.g., Gemini or ChatGPT).

Set goals and conversions

An essential part of data analysis is checking the events that users have taken on the website. Some of the basic events, such as form submissions or phone number clicks, are detected and marked by Google itself, but not always. How can you check this?

Go to Settings, then Events. There, you will see a list of events that are already in your data. If something is missing, click Create Event and configure the goal you want to measure.

events ga4

Source: GA4

 What events are worth measuring?

  •  Form submissions
  •  Newsletter subscriptions
  •  Phone number clicks
  •  File downloads (if, for example, you encourage users to download an offer)
  •  Adding products to the cart

…and much more! It all depends on the specifics of your business and the goals that are important to you. If you need help configuring Events in GA4, we can help.

How to interpret data in GA4?

You’re already measuring everything you want; the report is configured, and you’re looking at the data. What’s next? Examine the distribution of data over time, compare periods with one another, and review the charts to identify trends and tendencies. Is the number of users from the sources you focus on increasing or decreasing? If you know that something has changed in your strategies and, for example, you are now allocating a larger budget to paid traffic, analyze whether you see the effect and what the conversions from this channel look like.

If you notice any inconsistencies, such as increased traffic from social media but still low or declining conversions, consider revisiting the message. Is the ad content misleading? The campaigns may be poorly targeted, attracting people who are not interested in your offer. Asking questions and seeking answers in the form of data is the foundation of effective marketing.

Creating a report in GA4 – what is worth remembering?

  •  The best report is one that answers questions. Therefore, before you look at GA4, consider what your success metrics will be.
  •  Monitor how users interact with the website. If you determine how many people visited the website from LinkedIn, analyze what they did once they arrived.
  •  If you see something disturbing, dig deeper. Do users who visit the site from Facebook ads tend to leave immediately? The problem may lie with the message itself or an unintuitive website.
  •  The simplest report will be to check sources, engagement, and conversions. To begin with, this data will provide you with a wealth of information.

When building a report in GA4, you don’t need a “dream dashboard.” You need a one-page document that shows whether your actions are actually making a difference. Because a report that reassures you is not a report, it’s an illusion. A well-prepared report in GA4 is not intended to convince you that everything is working perfectly. It’s meant to show you where it stopped working.

Author
Tomek Gniecki - SEM & Analytics Specialist
Author
Tomek Gniecki

SEM & Analytics Specialist

Graduate of Marketing and Market Communication at Cracow University of Economics. At Delante he is involved in running Google Ads campaigns and the implementation and configuration of Google Analytics. He also conducts training in web analytics. Privately a guitarist, a lover of heavy music and good football.

Author
Tomek Gniecki - SEM & Analytics Specialist
Author
Tomek Gniecki

SEM & Analytics Specialist

Graduate of Marketing and Market Communication at Cracow University of Economics. At Delante he is involved in running Google Ads campaigns and the implementation and configuration of Google Analytics. He also conducts training in web analytics. Privately a guitarist, a lover of heavy music and good football.